                   COLBY

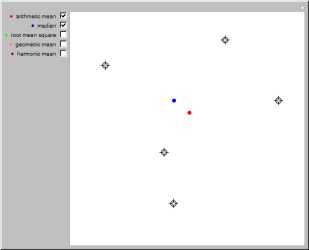
          Gives us eleven points, including the

          meth lab.  I see a map with a bunch of

          dots on it -- I figure you can tell

          me something -- maybe even find his

          stash house --

                   CHARLIE

          We know the order that the locations

          were arrived at -- what about doing a

          time series analysis of overlapping

          Dirichlet Tessellations?


Larry considers this for a beat -- then --


                   LARRY

          Wow.

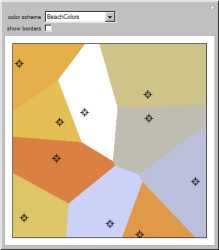
The
Voronoi diagram (also called
Dirichlet tessellation) for a set of points
S in the
plane is a partition of the plane into
convex polygons, each of which consists of all the points in the plane closer to one particular
point of
S than to any other.
Colby sits at a computer, running through a SERIES OF MUG

SHOTS as Don enters...


                   DON

          Any luck?


                   COLBY

          Facial recognition software, my brain

          is not.  But I've been through Intel's

          whole dossier on The New American

          Front, and I'm pretty sure he isn't in

          there.  Hooper giving us anything yet?

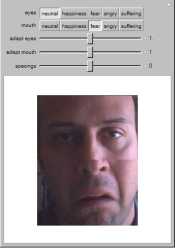
Facial expressions of happiness, fear, anger, and suffering can be reduced to the shapes of eyes and mouths. As
suggested by Adolphs, Tranel and Damasio, and Patrik Vuilleumier, the perceived emotions in facial expressions involve
processing by the amygdala.
Charlie, Amita, and Larry a swirl of activity, as, on

THE MAP --


Almost an inversion of what we've previously seen; the

spiderwebbed cracks are faded, and the highlighted zones

are where no streets had been touched --


                   CHARLIE

          How're we doing with the cluster

          radius changes?


                   AMITA

          Almost entered --

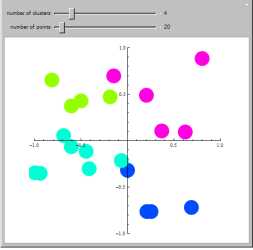
Cluster analysis groups data elements
according to a similarity function. In this case, the similarity function is simply the
Euclidean distance function, which allows
us to group them into clusters automatically based on how close they are.


